USD/JPY 2026 Forecast: Testing the Critical 152 Support and Complete Technical Analysis Across 4 Major Currency Pairs
(Advertisers wanted)
(Advertisers wanted)
📌 Topic & Subject
This article provides a comprehensive financial and technical market forecast for USD/JPY in 2026, focusing on the critical 152.00 support level and macroeconomic shifts such as Bank of Japan policy normalization and Federal Reserve recalibration. It also incorporates detailed quantitative metrics, Fibonacci geometry, and moving average analyses across four major currency pairs: USD/JPY, EUR/USD, GBP/USD, and AUD/USD.
(Advertisers wanted)
(Advertisers wanted)
📌 Table of Contents
- 1. Market Overview: The Historic 152.00 Structural Pivot and the Era of the Great Convergence
- 2. Quantitative & Technical Metrics Across the Big 4 Currency Pairs
- 3. Institutional Divergence: Policy Makers & Global Investment Banks Go Head-to-Head
- 4. Macro Comparative Analysis: The Mechanics of 2022–2024 Interventions vs. The 2026 Shift
- 5. Trader Sentiment & Institutional Positioning: Retail dip-buying vs. Hedge Fund Momentum
- 6. The Hidden Plumbing: Knock-Out Barriers and GPIF Rebalancing
- 7. Tactical Trading Playbook: Navigating Sessions, Spreads, and Execution
- 8. Strategic Outlook & Professional Risk Advisory: The Multi-Horizon Roadmap
1. Market Overview: The Historic 152.00 Structural Pivot and the Era of the Great Convergence
The 152.00 price mark on the USD/JPY currency pair is considered by some analysts to be more than a standard round-number barrier; it may represent a macroeconomic inflection threshold where international policy, historic currency interventions, and massive sovereign capital flows intersect. To understand the structural gravity of 152.00, one must trace its historical provenance back to the aftermath of Japan's asset price bubble collapse in 1990. For thirty-two years, this psychological ceiling stood unchallenged until October 2022, when intense policy divergence pushed exchange rates into this boundary, leading to intervention from the Japanese Ministry of Finance (MoF). Although it temporarily resisted sustained advances through late 2023, the level gave way in the first half of 2024, unlocking an exponential multi-decade rally toward 160.00 and a peak of 162.50.
According to the technical polarity principle, multi-year resistance structures that absorb extreme institutional liquidity transform into formidable multi-year support shelves once breached. In 2026, foreign exchange dynamics have transitioned from an era of multi-decade policy divergence into what macro portfolio managers categorize as the 'Great Convergence.' For years, the global carry trade thrived on the Federal Reserve's ultra-tight monetary campaign juxtaposed with the Bank of Japan's (BOJ) negative interest rate policy (NIRP) and aggressive Yield Curve Control (YCC). That paradigm has completely expired. The Federal Reserve is reportedly managing the terminal phase of its restrictive trajectory by recalibrating benchmark rates toward a neutral setting, while the Bank of Japan is said to have disassembled YCC, exited NIRP, and embarked on a rate normalization path targeting benchmark corridor levels of approximately 1.00% to 2.00%.
This dynamic has exerted relentless compression on the US-Japan sovereign yield spread, altering the underlying fundamental calculus. Coupled with reported coordination between the United States Treasury and the Japanese MoF to address currency volatility, the trillions of dollars locked in structural yen carry trades face accelerating multi-stage unwinding pressures. Consequently, the 2026 retest of 152.00 is not a mere short-term technical bounce; it serves as the ultimate macro battleground determining whether the structural dollar-bull/yen-bear mega-cycle initiated in 2021 has definitively reversed into an enduring yen bull market or will validate 152.00 as the final structural support shelf of an extended super-cycle.
The Historical Polarity Shift: Resistance Turned Foundational Floor
In quantitative market profiling, polarity shifts across macro time horizons require extraordinary order book density to reverse. When 152.00 acted as overhead resistance throughout 2022 and 2023, billions in foreign reserve liquidations were executed by the MoF to cap upside runaway trends. Commercial hedgers, Japanese domestic institutional managers, and multinational exporters structured their multi-year dollar sales around this level. The final breach above 152.00 in 2024 eradicated those supply imbalances, forcing comprehensive buy-stop sweeps and institutional asset re-allocations.
Now operating from above, market auctions returning toward 152.00 trigger opposite order mechanics. The commercial exporters who once sold dollars at 152.00 now identify this level as an optimized floor to purchase domestic yen, while domestic lifers and pension entities calculate hedge ratios precisely around this polarity axis. The structural bid that preserved institutional balances above 152.00 over prior quarters has created a fortified liquidity cushion that requires sustained fundamental catalysts to dismantle.
The Macro Convergence: Bank of Japan Normalization vs. Federal Reserve Recalibration

The macroeconomic divergence that historically pushed the US dollar higher against the Japanese yen was anchored in extreme real interest rate differentials. In 2026, that spread has experienced historic quantitative contraction. The United States 10-year Treasury yield, which previously held elevated prints near 4.80%, faces a structural compression trend as Federal Reserve policymakers recalibrate toward economic equilibrium. Concurrently, 10-year Japanese Government Bond (JGB) yields have established stability in the 1.00% to 1.10% range following policy rate hikes and the withdrawal of domestic quantitative interventions.
This fundamental adjustment has reduced the nominal US-Japan sovereign 10-year yield spread from peak historic divergences of approximately 460 basis points (4.60% points) down to a tighter channel of 250 to 275 basis points. Because institutional carry trades necessitate a wide yield spread buffer to absorb foreign exchange volatility, this structural spread compression inherently reduces the annualized Sharpe ratio of long USD/JPY positions, systematically dismantling the institutional incentive to finance carry strategies using low-yielding yen.
2. Quantitative & Technical Metrics Across the Big 4 Currency Pairs
A rigorous evaluation of global currency markets requires analyzing USD/JPY within the broader matrix of cross-currency liquidity, relative yield metrics, and structural chart geometry across the four major G10 pairs. Market conditions post-155.00 breakdown have established a highly technical trading landscape across USD/JPY, EUR/USD, GBP/USD, and AUD/USD, marked by clear inflection levels, dynamic moving average confluences, and defined statistical parameters.
| Currency Pair | Current Price Range | Core Structural Support | Key Overhead Resistance | Technical Confluence & Momentum Indicators |
|---|---|---|---|---|
| USD/JPY | 152.89 – 156.27 | 152.00 – 152.09 (Weekly Pivot S2, Monthly S3, 50.0% Fib); 149.00 – 148.09 (61.8% Fib); 145.00 (Long-term Macro Trendline) | 154.15 – 154.40 (4H Descending Trendline); 155.00 – 155.50 (Prior Intervention Shelf, 100/200 Daily SMA); 158.00 / 162.50 (Channel Top) | Breakdown below 155.00 confirmed; yield spread compressed to 250–275 bps; 14-day RSI oversold divergence developing near 152.00; multi-billion knock-out barrier cluster at 152.00. |
| EUR/USD | 1.1580 – 1.1623 | 1.1500 (Daily 100-period SMA & Psychological Round Support) | 1.1710 – 1.1733 (Daily 200-period SMA & 23.6% Fibonacci Retracement) | 14-day RSI positioned neutral at 50.5; daily MACD exhibits a bearish crossover above the zero line; price compressed inside an ascending wedge/neutral consolidation range. |
| GBP/USD | 1.3200 – 1.3240 | 1.3050 – 1.3100 (Prior Horizontal Swing Low & Daily 50 SMA) | 1.3240 (Multi-top Resistance); 1.3400 (Institutional Channel Objective) | Constructing a high-timeframe bullish flag formation; relative strength powered by UK fiscal discipline and Bank of England cautious easing pace; MACD printing positive histogram expansion. |
| AUD/USD | 0.7150 – 0.7200 | 0.7080 – 0.7100 (Horizontal Structural Base & 50-day SMA) | 0.7200 (Breakout Trigger); 0.7276 – 0.7283 (2022 Historic Highs); 0.7418 (Air-pocket target) | Testing a major cyclical ceiling at 0.7200; clear volume profile air pocket between 0.7283 and 0.7418 (23.6% pandemic range Fibonacci retracement); sensitive to raw material demand cycles. |
USD/JPY Technical Blueprint: Fibonacci Geometry and Moving Average Confluences
Following the technical breakdown below the primary 155.00 threshold, USD/JPY entered a defined lower channel, consolidating within a weekly transaction envelope between 152.89 and 156.27. Technical technicians map this structural transition through precise mathematical milestones:

- The 152.00–152.09 Baseline: Represents the confluence of the Weekly Pivot S2, the Monthly Pivot S3, and the critical 50.0% Fibonacci retracement measured from the macro cyclical cycle spanning the 2023 lows to the 2024–2025 historic summits. Structural integrity here is paramount.
- The 149.00–148.09 Demand Pocket: Represents the 61.8% Fibonacci Golden Ratio retracement level. A clean break of 152.00 directly exposes this corridor, which acted as a primary institutional accumulation zone during earlier re-accumulation cycles.
- The 145.00 Macro Trendline: Anchors the long-term cyclical trend boundary that originated from the 2021 launch point. Testing this level would equate to a total unwinding of the speculative risk premium accumulated across the multi-year cycle.
On the upper distribution boundary, USD/JPY faces dense technical resistance. The 154.15 to 154.40 zone marks the declining trendline originating on the 4-hour time horizon, operating as the first gatekeeper for intraday mean reversion. Higher up, the 155.00 to 155.50 band forms a heavy resistance cluster, where the prior MoF intervention support level now perfectly coincides with the downward-sloping 100-day and 200-day Simple Moving Averages (SMA). The upper boundaries of the medium-term macro descending channel sit anchored at 158.00 and 162.50.
Cross-Pair Dynamics: EUR/USD, GBP/USD, and AUD/USD Technical Structures
EUR/USD trades within a compressed trading band between 1.1580 and 1.1623. Moving average analysis highlights price action coiling between the 100-day SMA situated at 1.1500, which offers structural demand, and the 200-day SMA aligned with the 23.6% Fibonacci retracement at 1.1710 to 1.1733, acting as overhead resistance. Momentum analysis provides a neutral reading, with the 14-day Relative Strength Index (RSI) hovering at 50.5, while a daily MACD bearish crossover above the zero line reflects consolidation rather than aggressive trend expansion.
GBP/USD displays robust momentum among the primary European pairs, repeatedly testing multi-top resistance across the 1.3200 to 1.3240 price shelf. Structural momentum indicators reveal a continuous high-timeframe bull flag. Solid UK fiscal commitments coupled with a measured approach to monetary easing from the Bank of England (BOE) maintain relative rate resilience. An institutional breach above 1.3240 opens an unencumbered pathway toward the 1.3400 institutional objective, supported by strong volume profiles and expanding MACD histogram lines.
AUD/USD tests a multi-year horizontal barrier between 0.7150 and 0.7200. A decisive breakout above 0.7200 exposes the annual peak of 0.7276 and the prominent 2022 high of 0.7283. Technical charting identifies a significant 'volume air pocket' extending from 0.7283 to 0.7418, which marks the 23.6% Fibonacci retracement of the broader pandemic low-to-high wave. Given minimal historical liquidity execution within this zone, a clean push past 0.7283 could induce a rapid vacuum move toward 0.7418, driven by commodity-linked foreign demand.

3. Institutional Divergence: Policy Makers & Global Investment Banks Go Head-to-Head
The institutional investment community reportedly holds differing views on whether USD/JPY 152.00 represents a significant buying opportunity or a potential risk for further currency decline. Central bankers, treasury officials, and tier-1 investment bank strategists present contrasting fundamental theses.
United States Treasury Secretary Scott Bessent has signaled support for Japanese authorities' efforts to curb excessive currency volatility, viewing monetary normalization as beneficial for regional foreign exchange stability and fair trade conditions.
The stance reportedly reflects a shift towards structured bilateral cooperation. The US Treasury’s explicit endorsement of BOJ normalization provides geopolitical clearance for Japanese authorities to defend domestic currency values without risking classification as unilateral exchange manipulation.
JPMorgan strategists, including Co-Head of Global FX Strategy Meera Chandan, have noted that Japanese authorities are cautious regarding rapid yen appreciation, pointing out that existing sovereign yield differentials could limit sustained downward moves and leave room for a potential rebound.
Some analysts, including those at J.P. Morgan, focus on the remaining positive carry differential. While yield spreads have tightened from peak extremes, the absolute interest rate buffer favoring US assets remains intact. Should domestic Japanese corporate balance sheets face margin pressure from sudden yen strength, speculative momentum could reverse, initiating an aggressive squeeze back toward 164.00.
Bank of America FX strategist Alex Cohen has observed that faster rate hikes from the Bank of Japan are a key condition for further yen appreciation, which could be supported by capital repatriation by Japanese exporters if the currency stabilizes.
Some analysts shift the focus from retail carry speculation to the offshore corporate balance sheets held by Japanese enterprises. The repatriation of foreign retained earnings into domestic-denominated accounts represents a major non-speculative liquidity wave capable of establishing an enduring floor under the yen.
Wells Fargo macro strategist Eric Nelson has highlighted that much of the Bank of Japan's tightening path is already reflected in market pricing, making it challenging for the central bank to deliver monetary tightening surprises that exceed current expectations.
Some analysts highlight the domestic limitations constraining the BOJ. With domestic consumer demand still sensitive to broader price pressures and real wage gains pacing unevenly, aggressive tightening paths remain vulnerable to economic speed limits, preventing the BOJ from out-hiking market expectations.
Technical analysts note that a sustained breakdown below 155.00 marks a significant structural shift. If the 152.00 support floor fails to hold institutional demand, a broader decline toward the 150.00 level and the upper 140s could accelerate.
ee fall."— Shaun Osborne & Eric Theoret, FX Strategy Team, Scotiabank
Scotiabank's quantitative mapping emphasizes the vacuum-like profile residing below current price action. A breakdown below the primary 152.00 shelf exposes deep liquidity voids where programmatic stop-loss systems could trigger rapid price discovery downward toward 148.00.
"Against a macro backdrop where US recession risks remain subdued while the Higher-for-Longer monetary policy stance endures, gradual rate increases by the Bank of Japan alone are insufficient to overturn structural outward portfolio capital flows. Even if intermittent episodes of yen strength emerge, USD/JPY retains significant upside risks of mean-reverting toward the 162.00–165.00 secular resistance corridor over a 3- to 6-month tactical horizon."
— Global Macro Research Team, Goldman Sachs
Goldman Sachs warns against declaring an early end to structural dollar demand. As long as US real economic expansion outpaces broader G10 competitors, capital naturally gravity-feeds into dollar-denominated assets, meaning downside moves toward 152.00 risk running into intense institutional absorption.
4. Macro Comparative Analysis: The Mechanics of 2022–2024 Interventions vs. The 2026 Shift
Navigating the current foreign exchange environment requires contrasting the operational dynamics of past MoF market interventions with the fundamental macro landscape driving markets in 2026. The historical interventions executed in late 2022 at 151.94 and during the second quarter of 2024 across 160.00 to 162.50 were transactional operations reliant almost entirely on the MoF's physical foreign reserve liquidations. Japanese authorities conducted massive dollar-selling operations directly into interbank liquidity pools.
During those operations, the broader macroeconomic landscape ran directly counter to the MoF's objectives. The Federal Reserve was executing an aggressive rate-hiking campaign, while the BOJ remained committed to ultra-loose monetary policy, negative benchmark rates, and yield curve suppression. Consequently, while direct state interventions generated sharp temporary pullbacks spanning 500 to 1,000 pips, they functioned primarily as tactical pauses. Global capital naturally gravitated back to the wide interest rate differential, quickly leading to V-shaped recoveries that eventually pushed beyond intervention thresholds.
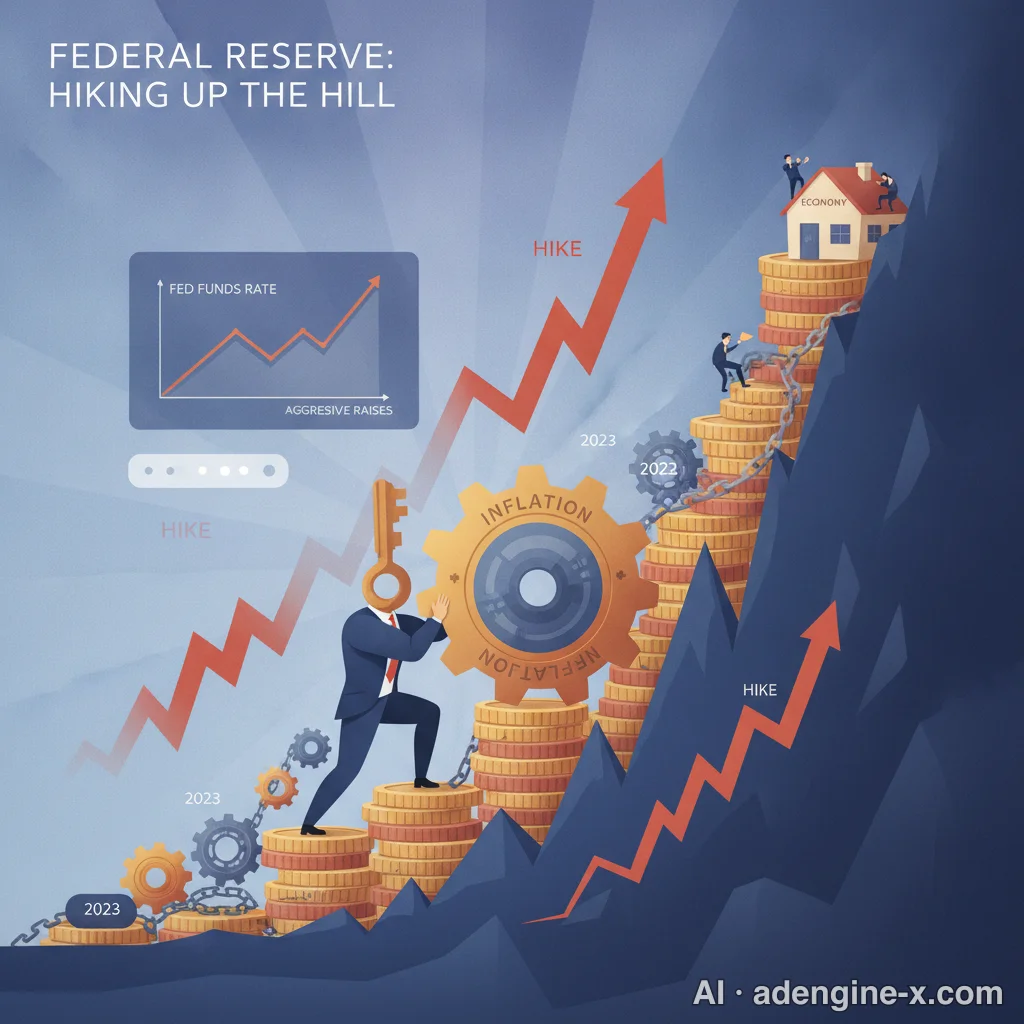
The 2026 landscape operates under fundamentally different structural dynamics. Current price discovery is driven by organic interest rate convergence rather than reactive physical reserve depletion. The Federal Reserve is actively lowering benchmark financing rates, while the BOJ is steadily lifting benchmark rates into a neutral band. This dynamic compression in the US-Japan sovereign yield spread—from 460 basis points down to 250–275 basis points—fundamentally alters asset allocation incentives. Furthermore, this adjustment takes place with the explicit coordination of the US Treasury, neutralizing the geopolitical and cross-border currency frictions that frequently compromised historical market defenses. The 2026 test of 152.00 represents institutional portfolio re-allocations rather than transient speculative positioning.
Policy Divergence and Cross-Currents Across the G10 Currency Matrix
Cross-asset dynamics across the primary G10 pairs illustrate how monetary policy shifts drive performance across the major currency blocs:
- USD/JPY vs. EUR/USD: The persistent downward pressure on USD/JPY stems directly from rapid US-Japan yield spread compression. In contrast, EUR/USD remains locked in a consolidation band between 1.1500 and 1.1730. While the US dollar faces softening yields, the European Central Bank (ECB) contends with regional growth headwinds and sovereign debt spread widening, particularly between French and German government debt. These domestic European pressures neutralize EUR upside, capping EUR/USD momentum into a defined range.
- USD/JPY vs. GBP/USD: The British pound has emerged as an outperformer among major currencies. Supported by UK fiscal commitments and a measured easing cycle from the Bank of England, the pound retains a solid relative rate profile. While USD/JPY trades with a heavy, downward-drifting tone, GBP/USD maintains a well-defined ascending channel, challenging 1.3240 on a trajectory toward 1.3400.
- USD/JPY vs. AUD/USD: The Australian dollar acts as a cyclical risk-on proxy. While aggressive unwinding of yen carry trades often induces short-term volatility in risk assets—temporarily weighing on the AUD—the accompanying declines in the broader US Dollar Index (DXY) provide countervailing support. As commodity demand recovers, AUD/USD shows increasing resilience, pressing the 0.7200 breakout boundary while displaying structural independence from traditional USD/JPY trend lines.
5. Trader Sentiment & Institutional Positioning: Retail dip-buying vs. Hedge Fund Momentum
Trading desks and market forums, including Reddit’s r/Forex, ForexLive, and institutional execution channels, reveal a polarized positioning environment around the 152.00 level. Retail trading accounts and institutional hedge funds exhibit sharply divergent strategies, leading to intense liquidity battles across global trading sessions.
Retail foreign exchange traders show a strong propensity for mean-reversion positioning. Conditioning built over several years—during which 152.00 acted as a formidable upside target—has fostered a retail perspective that 152.00 now functions as an unbreakable floor. Retail order books indicate heavy long accumulations between 152.50 and 153.00, with participants anticipating a technical rebound back into the upper-150s. Conversely, institutional commodity trading advisors (CTAs) and systemic trend-following hedge funds have implemented breakdown strategies following the breach of 155.00. Institutional desks routinely employ a 'fade into rallies' approach, deploying algorithmic sell programs into intraday bounces toward the 154.15–154.40 technical zone.
The Transition of 'Mrs. Watanabe' and Retail Carry Position Unwinding
Within Japan’s retail margin trading demographic—often referred to as 'Mrs. Watanabe'—the rapid compression from 160.00 down toward 152.00 has generated noticeable portfolio adjustments. For several years, domestic Japanese retail accounts held leveraged long USD/JPY positions, generating consistent positive swap yields. However, as the pair broke below key technical levels, capital losses on spot positions quickly overshadowed accumulated interest payouts.
The swift move beneath 153.50 triggered forced margin liquidations and automated stop-loss executions across Japanese retail platforms. Rather than absorbing these pullbacks with fresh margin deposits, retail positioning has turned cautious. Forced retail liquidations have contributed to intra-session liquidity vacuums, amplifying localized intraday slippage whenever key technical price points are breached.

CFTC Commitments of Traders (COT) Institutional Positioning Shifts
Official Commitments of Traders (COT) data released by the Commodity Futures Trading Commission (CFTC) highlights a structural shift in broader market sentiment. Over the course of the multi-year rally, non-commercial speculative positioning maintained historic net-short yen holdings. However, across recent reporting cycles, those speculative net-short balances have experienced substantial unwinding, shifting back toward neutral and approaching net-long positioning.

This positioning shift has fueled active debate across institutional market desks. One contingent views the unwinding of historical carry positions as structural evidence that the multi-year dollar bull market has ended. The opposing camp maintains that as long as nominal US short-term benchmark yields remain comfortably above domestic Japanese rates, the positive carry trade will continue to attract capital, presenting attractive long-entry pricing around the 152.00 support shelf.
6. The Hidden Plumbing: Knock-Out Barriers and GPIF Rebalancing
Beneath standard chart patterns lies the institutional market microstructure that governs foreign exchange order books. Ordinary market participants typically rely on basic technical indicators, often overlooking the deeper financial engineering and institutional mechanics that dictate price delivery at pivotal levels like 152.00.
The Volatility Dynamics of Knock-Out Barrier Options
The primary driver behind volatile price action near major round numbers is the concentration of specialized over-the-counter (OTC) structured products. Global investment banking divisions have issued billions in structured notes and exotic FX options to institutional accounts, with prominent Down-and-Out Call and Down-and-Out Put knock-out barriers clustered directly at 152.00 and 150.00.
The operational mechanics of these options create distinct market behavior:
- Pre-Barrier Defenses: While spot prices trade comfortably above 152.00, market-making investment banks maintain dynamic delta hedges. To protect their premium revenue, desks often enter buy orders just above the barrier (e.g., between 152.10 and 152.30), working to prevent the spot price from triggering the knock-out event.
- Post-Barrier Liquidity Voids: Should cumulative market selling overwhelm those defensive orders and push the spot rate to 152.00, the barrier is breached and the underlying options contract instantly expires worthless. Consequently, the dealer's requirement to hold long spot USD/JPY hedges disappears immediately. Market-making algorithms must instantly dump accumulated spot long positions into the interbank market to neutralize portfolio gamma. This programmatic liquidation can trigger a sudden liquidity vacuum, rapidly driving prices down toward 151.50 without intervening resting bids.
Government Pension Investment Fund (GPIF) and Toshin Portfolio Shifts
A second major structural driver is the institutional portfolio rebalancing executed by the Government Pension Investment Fund (GPIF) of Japan, the world's largest sovereign pension fund managing roughly 240 trillion yen in total assets. The GPIF operates under defined asset allocation benchmarks, systematically balancing domestic bonds, domestic equities, foreign bonds, and foreign equities.

With domestic 10-year JGB yields stabilizing above the 1.00% threshold, domestic Japanese sovereign debt offers positive nominal yields that satisfy foundational liability matching requirements without exposing capital to offshore currency risk. As a result, major Japanese institutional funds and domestic Toshin (mutual fund) asset managers have initiated asset realignment programs. By reducing allocations to unhedged foreign debt obligations and redirecting capital back into domestic paper, these institutions generate a steady underlying demand for domestic yen, providing structural reinforcement to the ongoing macro convergence.
7. Tactical Trading Playbook: Navigating Sessions, Spreads, and Execution
Successfully executing institutional-grade trading strategies around the USD/JPY 152.00 pivot requires a structured tactical playbook. This entails managing execution windows across trading sessions, accounting for financing swap changes, and implementing strict capital preservation protocols.
Session Liquidity Profile and Volatility Windows
Foreign exchange liquidity fluctuates noticeably across the three primary trading sessions, each displaying distinct institutional order flow patterns:

- Tokyo Trading Session (09:00 – 15:00 KST / JST): Price discovery during the Tokyo session is heavily shaped by commercial demand, specifically during the fixing window leading up to 09:55 KST (the Tokyo Nakane fixing). This is when domestic commercial banks calculate daily commercial exchange rates, frequently resulting in large physical transactions from importers and exporters. Defensive bids around 152.00 frequently manifest during this session, driven by domestic asset managers and commercial accounts.
- London / New York Session Overlap (21:30 – 01:00 KST / JST): This overlap is the highest-volume trading window of the day, processing over 60% of total daily global foreign exchange turnover. The publication of major US economic metrics—including the Consumer Price Index (CPI), Non-Farm Payrolls (NFP), and ISM Purchasing Managers' data—occurs within this window. Interbank liquidity conditions during these data releases can widen trade spreads, leading to price slippage of 15 to 30 pips within fractional seconds.
- New York Daily Close & Bank Rollover (06:00 KST / 05:00 Daylight Saving Time): The daily settlement window when interbank networks clear overnight financing is characterized by wide spreads. For approximately fifteen minutes surrounding the daily rollover cut, standard retail pricing spreads of 0.2 to 0.8 pips can widen to 2.0 to 5.0 pips due to temporary market-maker withdrawal. Placing tight stop-loss orders around 152.00 during this brief settlement window carries an elevated risk of execution at adverse prices purely due to spread widening.
Swap Economics and Position Financing Dynamics
The narrowing of the US-Japan interest rate differential has significantly altered overnight holding economics. While carrying long USD/JPY positions previously yielded substantial positive daily swap payments, the net interest differential has diminished. Long trades still accrue marginal positive carry, but it no longer provides an adequate financial buffer against adverse market swings.
Conversely, holding short USD/JPY positions—which once incurred significant negative interest carry—has become notably less costly. The daily negative swap friction applied to short exposures has contracted by more than half compared to peak cycle periods, lowering the balance sheet cost for institutional fund managers to maintain medium-term short positions targeting broader downward trends.
Specific Tactical Execution Playbook for 152.00
When executing setups around this key level, institutional risk parameters dictate precise entry triggers and contingency boundaries:
- Scenario A: Defended Support and Long Bounce Execution
- Trade Entry Trigger: Confirm clean price stabilization across the 152.00–152.20 support band, validated by an intraday bullish divergence on the 4-hour RSI along with structural absorption of sell volume.
- Stop-Loss Calibration: Avoid placing stop-loss orders directly at the psychological round figure of 152.00, which attracts liquidity runs. Instead, position stops within the 151.40–151.60 pocket, safely below historical intra-session spikes and key technical support pivots.
- Target Milestones: Scale partial profits at the initial overhead channel boundary of 154.15–154.40, targeting secondary objective zones at 155.00–155.50 (the 100/200-day daily moving average confluence).
- Scenario B: Decisive Structural Breakdown and Short Execution
- Trade Entry Trigger: Wait for a verified daily candle close below 152.00, followed by a failed 4-hour retest that confirms the 152.00 level has flipped into intraday resistance (ideally entering near 151.80).
- Stop-Loss Calibration: Position the stop-loss strictly back above 152.60 to protect against a false breakdown trap.
- Target Milestones: Target the primary 61.8% Fibonacci retracement level located at 149.00–148.09, maintaining an open runner for an extended move toward the broader 145.00 macro trendline.
8. Strategic Outlook & Professional Risk Advisory: The Multi-Horizon Roadmap
As markets navigate the 2026 trading environment, the directional path of the US dollar against the Japanese yen will be dictated by the fundamental balance between policy normalization and sovereign yield dynamics. Navigating this landscape requires balancing short-term tactical opportunities with broader macroeconomic trends.
The Macro Roadmap: Identifying the 2026 Core Baseline
Foreign exchange flows indicate that the period of persistent, one-way dollar strength has passed. However, the path ahead is unlikely to be a direct, unhindered drop for the currency pair. Because US benchmark borrowing rates remain structurally higher than those of Japan, the positive carry differential continues to act as a partial stabilizer against runaway downside moves. The base-case scenario for 2026 outlines a volatile, multi-month consolidation process within the 148.00 to 158.00 range, rather than an immediate return to the 130.00 region.
Traders and asset allocators should closely track real economic performance indicators from the United States alongside wage and inflation figures from Japan. If US economic resilience keeps short-term yields firm while the BOJ pauses its tightening path, USD/JPY is positioned to stage recurring mean-reversion rallies that test the overhead 158.00 resistance boundary. Conversely, should the Fed accelerate its rate-cutting pace while the BOJ steps up rate increases, the key 152.00 baseline will face immense pressure, opening the door to a deeper technical test of the 145.00 structural foundation.
Defensive Portfolio Guidelines and Risk Notice
Operating in high-volatility currency markets requires institutional discipline. Leveraged foreign exchange trading entails substantial financial risk, where sudden market swings can lead to significant balance sheet drawdowns. Participants should ensure that account leverage remains conservative, particularly when navigating macro inflection barriers where knock-out options can trigger rapid localized volatility.
Notice: The quantitative metrics, key price levels, and institutional perspectives presented in this analysis are structured for informational and technical analytical purposes only. They do not constitute formal investment advice or actionable financial mandates. Specific terms, lending rates, and transaction executions are subject to individual broker terms, regulatory guidelines, institutional evaluations, and official policy notices. Strict risk management should govern all capital deployments across global foreign exchange pairs.
ℹ️ This article was drafted with the help of an AI tool and reviewed/edited by a human before publishing. · Original: AdEngine-X
📚 References
This list may include both live search sources the AI referenced while writing and public-data sources checked during fact verification. Please verify the original sources before citing or reusing.
0 Comments
Loading comments...